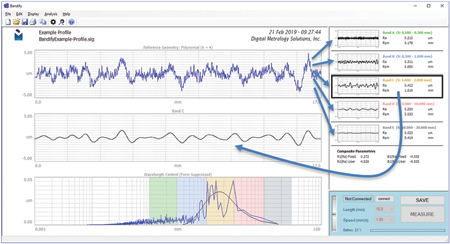
Bandify software shows a cross-section of the surface texture finish (top), and the texture divided into five user-configurable wavelength bands (right). Clicking any band displays that band in the center of the screen, along with surface texture parameters and a graph of the wavelength content.

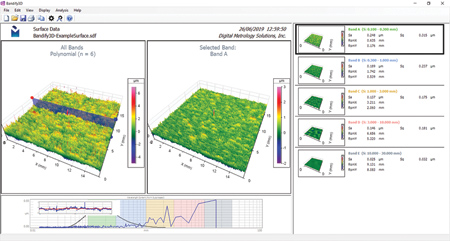
Bandify3D image showing the 3D surface texture (left) and short-wavelength texture (center). By focusing on this wavelength, striations across the data from a prior machining process are made apparent. The software makes it possible to analyze whether such aspects of the surface texture will affect the appearance and performance of a surface finish.
Digital Metrology Solutions, provider of measurement software, consulting and training, has released two new products for multi-band surface texture analysis. Bandify and Bandify3D instantly separate surface texture into wavelength bands and display the data in an intuitive, single-screen interface.
"To produce surface finishes that both look good and perform well, you need to understand the spatial wavelengths within the surface texture," explained Dr. Mark Malburg, President of Digital Metrology Solutions. "A roughness number alone cannot tell you whether a paint coat will appear glossy, if a gasket will seal or if a gear will make noise. Understanding the impact of various wavelength domains leads to a better understanding of these complex functions."
"Bandify is the first software tool designed exclusively to analyze surface texture simultaneously over several user-defined wavelength bands," said a company spokesperson. The software reports wavelength-specific surface parameters, with user-defined tolerance bands to highlight out-of-spec conditions.
Bandify can analyze data from a wide variety of surface measurement instruments, making it a common platform for all measuring systems. A selection of stylus-based profiling instruments can even be controlled directly from Bandify for "one click" measurement and analysis.
Bandify3D provides similar information for 3D surface measurement data, also in a single-screen user interface.
Because every application has unique requirements, the wavelength bands are fully customizable in Bandify and Bandify3D, with user-configurable cutoff wavelengths, display parameters and pass/fail limits. All settings can be saved as measurement "recipes" for various types of parts and/or process stages.
Both software packages feature drag & drop interfaces that let users analyze data in most standard formats, while batch process enables rapid analysis of hundreds of measurements at a time.
"The most important aspect of Bandify and Bandify3D is that the software lets engineers explore and interact with data," said Dr. Malburg. "Many other software packages can analyze surface texture in a general sense, but Bandify makes it exceptionally easy, and extremely fast, to see and understand textures in a wavelength-by-wavelength manner. More importantly, the software can clearly show the relationship between the wavelength domains. It provides the data to describe, specify, track and control the aspects of surface texture that will ultimately yield an excellent finish."
For more information contact:
Digital Metrology Solutions, Inc.
2024 Iroquois Trail
Columbus, IN 47203
812-314-0043
info@digitalmetrology.com
www.digitalmetrology.com